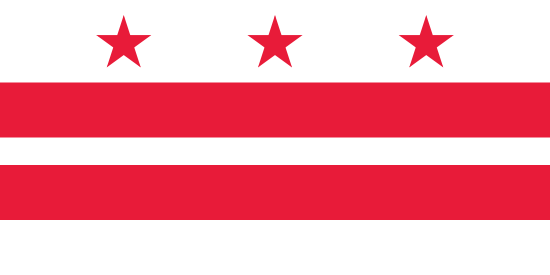
Washington, D.C., also known simply as D.C. or the District, is the capital of the United States. Washington, D.C. is a federal district under the jurisdiction of Congress, and thus is not a part of any state in the United States. The District was formed from land donated by Virginia and Maryland and named in honor of George Washington. If Washington, DC were a state, it would be the 49th most populous ahead of Wyoming and Vermont.
This district is a particularly small area, encompassing only 68 square miles of land and water. Only 61 square miles of land are available, and yet, this tiny area has the title of the highest density of population in the nation.
It has a population density of 11,535 people per square mile. During the work week, however, the population swells to more than one million as commuters come from Virginia and Maryland. The Washington metropolitan area has a population estimated at over 6 million, which makes it the 7th largest metro area in the United States. If the District is included with Baltimore and the suburbs, the Baltimore-Washington Metropolitan Area has a population of more than 9 million, which makes it the 4th largest CSA in the country.
The median age in Washington, DC is 33.8 years, with a slight gender gap of 52.5% female, and 47.5% male spread across the state.
There are many religions represented in Washington, DC, including Baptist (17%), Catholic (13%), Evangelical Protestant (6%), Methodist (4%), Episcopalian (3%), Jewish (2%), Eastern Orthodox, Pentecostal, Buddhist, Adventist, Lutheran, Muslim, Buddhist, Mormon, Hindu and Presbyterian.
The District of Columbia was formed in 1791 from territory ceded by Maryland and Virginia, but remained in some respects under their jurisdiction until the National government moved there in 1800. The District included the existing small cities of Georgetown and Alexandria as well as the site chosen for the Nation's new capital, Washington. In 1846 the portion south of the Potomac River, including Alexandria, was retroceded to Virginia.
In 1800 the census reported the District as part of Maryland and Virginia. All populations shown in the table exclude the portion returned to Virginia in 1846.
According to the most recent ACS, the racial composition of District of Columbia was:
Washington DC had very slow growth initially, with a population of only 100,000 after its first 70 years. This number more than doubled to 250,000 by the time the Civil War had ended and has grown steadily ever since.
The District's population has made more than a 7.5% increase since the 2010 Census, continuing a trend of growth set since 2000 after 50 years of decline. In 2010, Washington, DC was the 24th most populous city. The Washington, DC area currently ranks 5th among metro areas in the US for population growth.
According to officials, the growth is due to people migrating to the area from other parts of the US. Growth is expected to continue into the future, with projections showing that the population may exceed 718,000 by 2030.
Washington D.C. has had a large African American population since its founding in 1791. Between 1800 and 1940, African Americans made up 30% of the population, reaching a peak of 70% in the 1970s before declining as more African Americans moved to the suburbs. Between 2000 and 2010, there was a 31% jump in the non-Hispanic white population and an 11.5% decline in the black population.
Approximately 1 in 7 Washingtonians are immigrants, many of whom come from El Salvador, Vietnam and Ethiopia. Due to the large number of immigrants who are not fluent in English, about 35% of District residents are considered functionally illiterate.
The largest Hispanic groups in Washington DC is Salvadoran, which have mostly settled in the Mount Pleasant area. It is estimated that there are over 18,000 Salvadorans living in Washtington D.C., with an estimated Hispanic population that totals over 45,000.
687K
Black or African American
White
Two or more races
Other race
Asian
Native American
Native Hawaiian or Pacific Islander
Household Type | Count | Average Size | Owner | Renter |
---|---|---|---|---|
All | 310,104 | 2.08 | 41.5 | 58.5 |
Non Family | 178,908 | 1.29 | 31.9 | 68.1 |
Married | 79,950 | 3.01 | 66.1 | 33.9 |
Female | 40,290 | 3.53 | 35.5 | 64.5 |
Male | 10,956 | 2.88 | 41 | 59 |
3.07
Average Family Size
2.08
Average Household Size
41.5%
Rate of Home Ownership
Married
Male
Female
NonFamily
owner
renter
Male
Female
Less Than 9th Grade
9th to 12th Grade
High School Graduate
Some College
Associates Degree
Bachelors Degree
Graduate Degree
High School Graduation Rate
Bachelors Rate
The highest rate of high school graduation is among islander people with a rate of 100%.
The highest rate of bachelors degrees is among white people with a rate of 92.42%.
All
Male
Female
$75,336
Average Earnings
$80,865
Average Male
$71,131
Average Female
Only English
Spanish
Other Indo-European Languages
Asian and Pacific Island Languages
Other Languages
82.69% of District of Columbia residents speak only English, while 17.31% speak other languages. The non-English language spoken by the largest group is Spanish, which is spoken by 9.05% of the population.
rate
15.44%
Overall Poverty Rate
13.8%
Male Poverty Rate
16.94%
Female Poverty Rate
The race most likely to be in poverty in District of Columbia is Native, with 31.54% below the poverty level.
The race least likely to be in poverty in District of Columbia is White, with 5.18% below the poverty level.
The poverty rate among those that worked full-time for the past 12 months was 1.35%. Among those working part-time, it was 20.07%, and for those that did not work, the poverty rate was 35.86%.
Married
Widowed
Divorced
Separated
NeverMarried
30.9%
Overall Marriage Rate
34.2%
Male Marriage Rate
28.0%
Female Marriage Rate
male
female
The age group where males are most likely to be married is Over 65, while the female age group most likely to be married is 35-44.
Married
Widowed
Divorced
Separated
NeverMarried
Less Than 9th Grade
High School Graduate
Some College
Bachelors or Greater
9.3%
Veteran Poverty Rate
26.43%
Veteran Disability Rate
LaborForceParticipation
71.4%
Labor Force Participation
65.8%
Employment Rate
7.1%
Unemployment Rate
LaborForceParticipation
Europe
Asia
Africa
Oceania
Latin America
North America
Non citizens include legal permanent residents (green card holders), international students, temporary workers, humanitarian migrants, and illegal immigrants.
Europe
Asia
Africa
Oceania
Latin America
North America
36.05%
Born in District of Columbia
86.51%
Native Born
13.49%
Foreign Born
7.2%
Non Citizen
6.3%
Naturalized
86.51% of District of Columbia residents were born in the United States, with 36.05% having been born in District of Columbia. 7.2% of residents are not US citizens. Of those not born in the United States, the largest percentage are from Latin America.