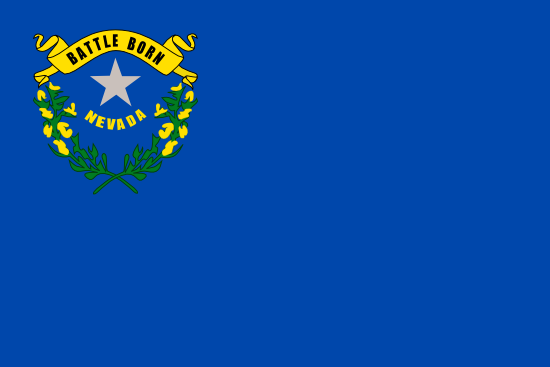
The landlocked state of Nevada is situated toward the western edge of the United States. According to the latest estimates from the Census Bureau, the population of Nevada is 2,890,845.
It covers a vast area of 110,567 square miles which makes it the seventh largest state in the country in terms of sheer land mass. However, this vast territory is very sparsely filled with Nevada’s citizens and in fact, there are only eight states in the country that are less densely populated. Nevada currently has one of the strongest growth rates in the country, reflecting a 7.05% population between 2010 and 2015, which ranks 6th in the nation.
The last estimate for the population was provided by the US Census Bureau in July 2015. The last confirmed figures were taken during the 2010 Census. At that time, it was revealed that 2,700,551 people had made Nevada their home, representing an increase of over 35% from the numbers declared at the end of the 2000 survey.
Based on those figures, the Census Bureau provides a new population estimate each year. In 2012, it estimated that the population of Nevada had increased to 2,758,931.
A relatively small percentage of Nevada's population lives in rural areas, such as Ely, West Wendover and Tonopah. The culture of rural Nevada is vastly different than the metropolitan areas, as most people in rural counties are native to the state, whereas Reno and Las Vegas are dominated by populations from other states, especially California. Rural populations are also less diverse, both racially and ethnically.
The largest metropolitan areas, and where the majority of the population is concentrated, includes Las Vegas, Henderson and North Las Vegas in Clark County and Reno in Washoe County.
The most populated city in Nevada is Las Vegas, and the most populated county is Clark County with over 2 million residents.
The median age in Nevada is approximately 37.5 years of age. The ratio of females to males is approximately 49.8% females to 50.2% males.
In religious terms, 66% of the Nevada population is affiliated with a Christian based faith, 5% are affiliated with non-Christian based faiths, and 28% are not affiliated with any particular religion at all.
Nevada was acquired from Mexico in 1848 and included in Utah and New Mexico Territories. It was established as a territory in 1861 from Utah Territory, and was admitted as a State on October 31, 1864. Nevada acquired essentially its present boundaries after the annexation of the southern tip from Arizona Territory in 1866.
In 1850 present-day Nevada had no census coverage. The population for 1860 is for the enumerated portions of Utah Territory that were included in Nevada Territory the following year. In 1870 coverage included the entire State. The 1870 population includes Rio Virgin County, enumerated as part of Utah although located within Nevada.
According to the most recent ACS, the racial composition of Nevada was:
Most states in the US tend to follow a similar pattern when it comes to their population history. Explosions in numbers tend to occur throughout the 19th century, and while the increases begin to slow down in the 1900s, the overall pattern is one of healthy growth through the 20th century as well.
In Nevada, however, that isn’t the case and throughout the state’s history, numbers have fluctuated greatly with impressive rises followed by clear falls on a census by census basis. In 1860, the population of Nevada was recorded at just 6,857 but an explosion of over 500% over the next ten years took those numbers to 42,941 by 1870. Much of the boom was as a result of a mining boom -- while other states had their Gold Rush, Nevada had its very own Silver Rush.
After the boom, though, came a devastating depression, and Nevada’s population dropped dramatically. In the ten years from 1880 to 1890, the population fell from over 60,000 to 47,355. A further decline of 10% between 1890 and 1900 reduced the population to just 42,335.
Another boom was just around the corner, though, and the 1900 discovery of a rich seam of gold and silver near Tonopah saw fortune seekers flock once again to the Silver State -- so many, in fact, that its population almost doubled within a decade.
It wasn’t until the latter half of the 20th century that changes settled down to record fairly stable increases. Even during this period, though, growth has been pretty spectacular by national standards. In every decade between 1950 and 2000, the population of Nevada grew by more than 50%. In fact, its growth of just 35% between 2000 and 2010 might be considered a bit disappointing.
Nevada was also hit especially hard by the housing collapse and economic recession, forcing many residents to flee back to their state of origin, in most cases California. Nevada is recovering nicely from this, however, and it is once again showing a very healthy growth rate.
Figures released in relation to natural growth tell the story of Nevada’s recent growing population and the main contributory factor comes with net migration. Between 2000 and 2007, natural growth (births minus deaths) had resulted in a gain of 81,661 citizens. However, net migration added to those numbers by an incredible 337,043.
Nevada clearly has the space for such gains, and it’s almost certain that the trend will continue. The question isn’t whether Nevada’s population will increase in the next ten years; the question is by how much.
Henderson and North Las Vegas are currently among the 20 fastest-growing cities in the United States with populations over 100,000. Interestingly, as Nevada continues to grow, its population becomes more diverse. The non-Hispanic white population has shrunk in every county in the state between 2010 and 2012 except for three counties, with Hispanic and Asian populations continuing to grow faster than any other.
According to Census Bureau figures, the growth in the state is driven mostly by people moving here from other countries and other states, and because the two biggest counties have lower mortality rates than the national average, despite typical fertility rates among residents.
Nevada's population is expected to continue its healthy climb and is estimated to reach 3.36 million residents by 2030
Hispanics and Latinos of any race make up approximately 28.1% of Nevada's population. The most common ancestries include: Mexican (20.8%), German (13.3%), Irish (10%), English (9.2%) and Italian (6.3%). Las Vegas in particular is a minority majority city with a fast-growing amount of ethnic communities, including Armenians, Spaniards, Greeks, Poles and Italians.
Asian Americans have had a significant population in Nevada since the California Gold Rush in the 1850s brought thousands of Chinese miners to Washoe County, who were followed by Japanese farm workers, then immigrants from China, Japan, Korea, the Philippines, India and Vietnam. Las Vegas now has the U.S.'s most prolific Asian American communities. The city has remained a large destination for immigrants from Latin America and South Asia seeking jobs in hospitality and gaming industries, along with farming and construction.
Nevada also has the highest population of illegal immigrants of any state in the United States, accounting for an estimated 8.8% of the total population.
200K
400K
600K
800K
1M
1.2M
1.4M
1.6M
1.8M
2M
2.2M
Nevada has a total of 16 counties, and of those counties, nine have exhibited growth in their populations. This is based on data from the 2010 Census when compared to 2015 estimates taken by the US Census Bureau. During this 5-year period, the southernmost county Clark County had the highest rate of growth at 8.26%. Three other counties exhibited growth greater than 5%, and these are Washoe, Esmerelda, and Elko Counties. Five other counties had smaller population growths, and these were Humboldt, Lyon, Douglas, Lander, and Eureka.
The remaining seven counties reflected decreases in population in 2015 when compared to 2010. Mineral County, located along the southern border, had the biggest decline at 6.14%, followed by Lincoln County at 6.01%. The counties of Nye, Storey, Pershing, Churchill, and White Pine all posted population declines of less than 5%.
White
Other race
Two or more races
Black or African American
Asian
Native American
Native Hawaiian or Pacific Islander
Household Type | Count | Average Size | Owner | Renter |
---|---|---|---|---|
All | 1,141,952 | 2.65 | 57.8 | 42.2 |
Married | 506,396 | 3.32 | 73 | 27 |
Non Family | 413,523 | 1.33 | 46.2 | 53.8 |
Female | 148,084 | 3.59 | 42.3 | 57.7 |
Male | 73,949 | 3.53 | 48.9 | 51.1 |
3.27
Average Family Size
2.65
Average Household Size
57.8%
Rate of Home Ownership
Married
Male
Female
NonFamily
owner
renter
Male
Female
Less Than 9th Grade
9th to 12th Grade
High School Graduate
Some College
Associates Degree
Bachelors Degree
Graduate Degree
High School Graduation Rate
Bachelors Rate
The highest rate of high school graduation is among white people with a rate of 94.07%.
The highest rate of bachelors degrees is among asian people with a rate of 41.44%.
All
Male
Female
$40,954
Average Earnings
$44,831
Average Male
$36,242
Average Female
Only English
Spanish
Other Indo-European Languages
Asian and Pacific Island Languages
Other Languages
70.14% of Nevada residents speak only English, while 29.86% speak other languages. The non-English language spoken by the largest group is Spanish, which is spoken by 20.55% of the population.
rate
12.88%
Overall Poverty Rate
11.81%
Male Poverty Rate
13.96%
Female Poverty Rate
The race most likely to be in poverty in Nevada is Black, with 22.65% below the poverty level.
The race least likely to be in poverty in Nevada is Asian, with 9.37% below the poverty level.
The poverty rate among those that worked full-time for the past 12 months was 2.66%. Among those working part-time, it was 14.42%, and for those that did not work, the poverty rate was 21.02%.
Married
Widowed
Divorced
Separated
NeverMarried
45.7%
Overall Marriage Rate
46.3%
Male Marriage Rate
45.1%
Female Marriage Rate
male
female
The age group where males are most likely to be married is Over 65, while the female age group most likely to be married is 45-54.
Married
Widowed
Divorced
Separated
NeverMarried
Less Than 9th Grade
High School Graduate
Some College
Bachelors or Greater
8.27%
Veteran Poverty Rate
29.82%
Veteran Disability Rate
LaborForceParticipation
63.4%
Labor Force Participation
58.5%
Employment Rate
7.1%
Unemployment Rate
LaborForceParticipation
Europe
Asia
Africa
Oceania
Latin America
North America
Non citizens include legal permanent residents (green card holders), international students, temporary workers, humanitarian migrants, and illegal immigrants.
Europe
Asia
Africa
Oceania
Latin America
North America
27.12%
Born in Nevada
80.82%
Native Born
19.18%
Foreign Born
9.23%
Non Citizen
9.95%
Naturalized
80.82% of Nevada residents were born in the United States, with 27.12% having been born in Nevada. 9.23% of residents are not US citizens. Of those not born in the United States, the largest percentage are from Latin America.