Oregon currently has a growth rate of 0.89%, which ranks 22nd in the country. Oregon's 2013 population was estimated to have grown to over 4 million, making Oregon the 27th most populous state in the country.
To establish the Oregon population in 2018, it's important to first look at the numbers from the last official US Census which was carried out in 2010. At that stage, it was confirmed that the Beaver State was home to 3,831,074 residents. That’s a sizable 12% rise in the numbers declared ten years earlier.
The northwestern state of Oregon is the 9th largest in the US in terms of land area, but it has a sparsely spread population by comparison. Geography plays a huge part -- mountain ranges and vast forest areas are just two of the geographical features that have an impact on population density in Oregon.
However, parts of this vast landscape are dominated by geographical features that are unsuitable for major settlement and as a result, there is an average of just 39.9 people living in every square mile of Oregon territory. This makes Oregon only the 39th most densely populated state in the country.
Much of Oregon's population is concentrated in the Willamette Valley from Eugene to the south through Corvallis, Salem, and Portland, the largest city. Portland is home to 630,309. Other major cities include Eugene (163,460), Salem (164,549), Gresham (110,553) and Hillsboro (102,347). Comparatively, the two most populated counties in the state are Multnomah at 807,555 and Washington at 588,957.
The median age across the population of Oregon is 39.1 years of age. In terms of the ratio of females to males, 50.5% females and 49.5% males is where the population currently stands.
In terms of the most preferred religions in Oregon, 61% of the population is affiliated with a Christian based faith, 7% are affiliated with non-Christian based faiths, and 31% of the population is not affiliated with a religion of any kind.
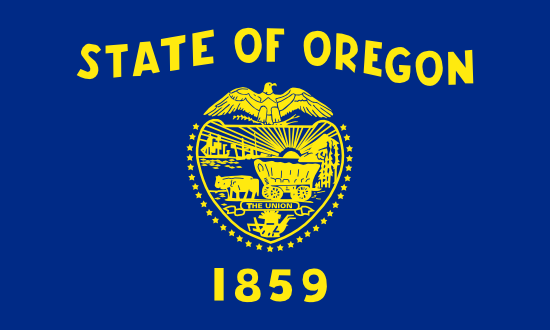
The Oregon region was long in dispute with Great Britain, and was jointly occupied by the two countries until definitively acquired by the United States in 1846. Oregon was established as a territory in 1848, including present-day Washington, Idaho, and parts of Montana and Wyoming. It acquired its present boundaries and was admitted as a State on February 14, 1859.
In 1850 the census covered only areas west of the Cascade Mountains; the 1850 total excludes persons enumerated in present-day Washington. In 1860 census coverage included the whole State.
According to the most recent ACS, the racial composition of Oregon was:
Early recorded figures show that in 1850, Oregon had a reasonably healthy population of 12,093. Those numbers were to increase by over 300% over the next ten years, and in 1860 the Oregon population was recorded at 52,465.
That was the largest rise on a decade by decade basis but the overall trend for the rest of the century was one of sustained growth, and by 1900, the population of Oregon was confirmed at 413,536.
Unlike other parts of the United States, that growth did not slow down for the first half of the 20th century, and by 1950, numbers had increased to 1,521,341. Further healthy growth has seen the population more than double over the past sixty years, and have taken the state to the present day where the population in 2016 has surpassed 4 million.
There is nothing to presently suggest that population growth in Oregon is set to slow down in the near future. By the time of the 2020 Census, it's estimated that the population will exceed 4.3 million. By 2030, estimates show the population will reach 4.8 million, an increase of over 41% from the 2000 population, while Oregon will reach 5.42 million residents by 2040.
Oregon has one of the lowest population percentages of African Americans in the nation, ranking 41st out of 50 states. The majority of the population -as well as the majority of the state's diversity- is located around the Portland metro area. The state's foreign-born population exceeds 300,000 and accounts for almost 9% of the total population, according to data from 2004.
Oregon's Native American population, in terms of percentage when compared to the state's total population, is ranked as 10th in the nation and tops the national average. Oregon ranks 12th in its percentage of Asian Americans when compared to the total population, and this percentage falls just short of the average of the US as a whole.
The largest ancestry groups in Oregon include: German (22.5%), English (14.0%), Irish (13.2%), Scandinavian (8.4%), American (5.0%), French (3.9%), Italian (3.7%) and Scottish (3.6%). Portland is Oregon's most diverse area, while there are high concentrations of Mexican-Americans in Jefferson and Malheur counties.
100K
200K
300K
400K
500K
600K
700K
There are a total of 36 counties in the state of Oregon, and interesting growth patterns have been observed when comparing data from 2010's Census to estimates taken in 2015 by the Census Bureau. Comparisons of this data show that the western counties of the state experienced growth in their populations during the 5-year period. Deschutes County experienced the most growth at 11.04%, followed by Washington County at 8.03%. Other western counties that saw growth include Jackson County at 4.5%, Polk County at 5.05%, and Clackamas County at 6.53%, just to name a few. There were also two counties located in the northeastern corner of the state that experienced some amount of population growth. Those counties were Umatilla and Union.
On the other side of both the growth chart and the state were the populations that declined during the same time period. These counties were located in the eastern portion of the state. Wheeler County had the highest loss in population at 6.15%, followed by Sherman County along the northern border at 5.14%. Other losses were recorded in Malheur, Harney, and Grant Counties, among others.
White
Two or more races
Asian
Other race
Black or African American
Native American
Native Hawaiian or Pacific Islander
Household Type | Count | Average Size | Owner | Renter |
---|---|---|---|---|
All | 1,658,091 | 2.49 | 63.2 | 36.8 |
Married | 795,014 | 3.12 | 79.7 | 20.3 |
Non Family | 620,511 | 1.37 | 47 | 53 |
Female | 164,445 | 3.27 | 48.1 | 51.9 |
Male | 78,121 | 3.25 | 54.3 | 45.7 |
3.03
Average Family Size
2.49
Average Household Size
63.2%
Rate of Home Ownership
Married
Male
Female
NonFamily
owner
renter
Male
Female
Less Than 9th Grade
9th to 12th Grade
High School Graduate
Some College
Associates Degree
Bachelors Degree
Graduate Degree
High School Graduation Rate
Bachelors Rate
The highest rate of high school graduation is among white people with a rate of 94.49%.
The highest rate of bachelors degrees is among asian people with a rate of 54.02%.
All
Male
Female
$43,305
Average Earnings
$50,642
Average Male
$36,971
Average Female
Only English
Spanish
Other Indo-European Languages
Asian and Pacific Island Languages
Other Languages
84.72% of Oregon residents speak only English, while 15.28% speak other languages. The non-English language spoken by the largest group is Spanish, which is spoken by 8.87% of the population.
rate
12.08%
Overall Poverty Rate
11.27%
Male Poverty Rate
12.87%
Female Poverty Rate
The race most likely to be in poverty in Oregon is Black, with 24.22% below the poverty level.
The race least likely to be in poverty in Oregon is White, with 10.79% below the poverty level.
The poverty rate among those that worked full-time for the past 12 months was 2.09%. Among those working part-time, it was 15.85%, and for those that did not work, the poverty rate was 19.84%.
Married
Widowed
Divorced
Separated
NeverMarried
49.1%
Overall Marriage Rate
50.0%
Male Marriage Rate
48.3%
Female Marriage Rate
male
female
The age group where males are most likely to be married is Over 65, while the female age group most likely to be married is 45-54.
Married
Widowed
Divorced
Separated
NeverMarried
Less Than 9th Grade
High School Graduate
Some College
Bachelors or Greater
7.65%
Veteran Poverty Rate
33.11%
Veteran Disability Rate
LaborForceParticipation
62.6%
Labor Force Participation
59%
Employment Rate
5.6%
Unemployment Rate
LaborForceParticipation
Europe
Asia
Africa
Oceania
Latin America
North America
Non citizens include legal permanent residents (green card holders), international students, temporary workers, humanitarian migrants, and illegal immigrants.
Europe
Asia
Africa
Oceania
Latin America
North America
45.89%
Born in Oregon
90.2%
Native Born
9.8%
Foreign Born
5.09%
Non Citizen
4.71%
Naturalized
90.2% of Oregon residents were born in the United States, with 45.89% having been born in Oregon. 5.09% of residents are not US citizens. Of those not born in the United States, the largest percentage are from Latin America.